
Blog
How to Know If Your Church Livestream Is Actually Working

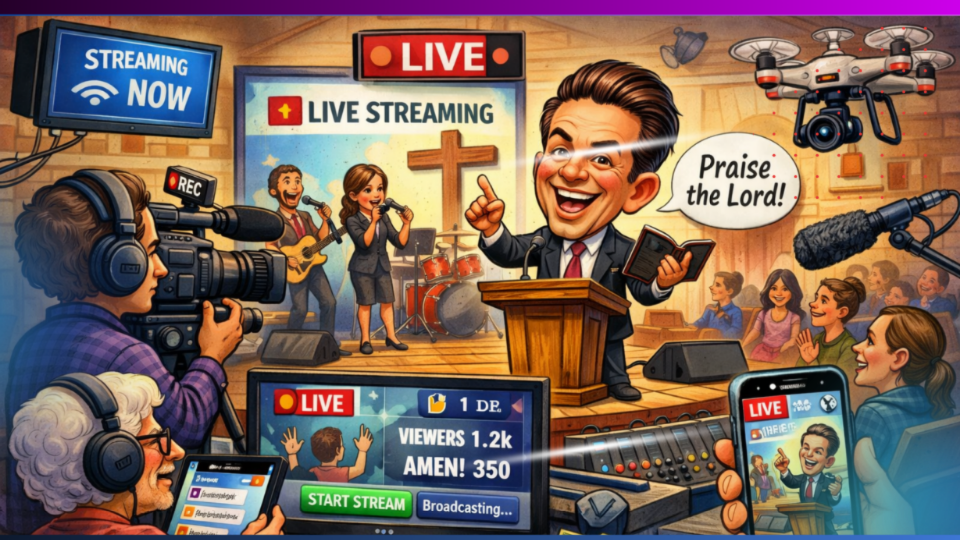
Livestream effectiveness refers to the measurable performance of a church’s live video broadcast across technical, engagement, and behavioral dimensions. A livestream is “working” when it meets minimum technical quality thresholds, retains viewer attention for a meaningful duration, and generates measurable audience actions beyond passive viewing. Evaluating effectiveness requires a defined set of key performance indicators (KPIs) tracked consistently over time.
The distinction between a functioning stream and an effective stream is significant. A stream that goes live without buffering satisfies a technical baseline. A stream that retains viewers, generates engagement, and drives follow-up behavior meets operational and ministry objectives.
Classification of Livestream Metrics
Livestream performance metrics fall into three categories:
- Technical metrics measure stream health, including bitrate stability, dropped frame rate, resolution output, audio levels, and latency.
- Engagement metrics measure viewer behavior during and after the broadcast, including concurrent viewers, average watch time, retention rate, chat participation, and replay views.
- Behavioral metrics measure downstream actions, including online giving, connection card submissions, prayer request completions, event registrations, and social media shares.
Each category addresses a different failure mode. A stream may be technically flawless but generate low engagement due to poor camera work. A stream may attract high concurrent viewership but fail to produce any follow-up actions due to missing calls to action in the broadcast itself.
Technical Quality Indicators
Bitrate and Resolution
Bitrate is the amount of data transmitted per second during a livestream, measured in kilobits per second (kbps). For 1080p resolution at 30 frames per second, the recommended encoding bitrate is 4,500-9,000 kbps (YouTube Live encoder settings, 2024). Consistent bitrate output without drops indicates reliable encoder and internet connection performance.
Resolution refers to the pixel dimensions of the video output. The standard baseline for church livestreams is 1920×1080 pixels (1080p) at 30 frames per second. Streams broadcast at 720p or lower may appear acceptable on mobile devices but display noticeably reduced quality on desktop monitors, smart TVs, and large displays.
Dropped Frames
Dropped frames occur when the encoder cannot process video data fast enough to maintain the target frame rate. Viewers see stuttering, freezing, or visual artifacts. The target is zero dropped frames. A dropped frame rate above 1% indicates encoder hardware limitations, insufficient CPU/GPU resources, or bandwidth congestion (OBS Project documentation, 2024).
Hardware encoders and dedicated streaming computers provide more consistent frame delivery than general-purpose laptops running software encoders under heavy load. Dedicated encoding hardware eliminates competition for system resources from other applications.
Audio Quality
Audio quality is the single most cited reason viewers leave a church livestream prematurely (BoxCast, “Church Streaming Statistics,” 2023). Consistent audio levels between -12dB and -6dB peak, absence of clipping, absence of background noise, and proper gain staging from the audio mixing board to the encoder constitute the minimum standard.
Audio issues include: microphone feedback, inconsistent volume between speakers and worship music, audio/video synchronization drift, and complete audio dropouts. Each of these issues causes immediate viewer attrition that does not recover within the same broadcast session.
Stream Latency
Stream latency is the delay between a real-time event and its appearance on a viewer’s screen. Three latency tiers exist: ultra-low latency (under 4 seconds), low latency (4-10 seconds), and normal latency (10-30 seconds). Lower latency enables more natural chat interaction but requires more encoding resources and bandwidth.
Engagement Metrics
Concurrent Viewers
Concurrent viewer count measures how many individuals watch the livestream at the same time. Platforms report both peak concurrent viewers (the highest simultaneous count during the broadcast) and average concurrent viewers (the mean count across the broadcast duration).
A functional benchmark: peak concurrent viewership between 10% and 30% of average in-person attendance indicates adequate online reach (Church Answers, “Church Online Attendance Benchmarks,” 2023). A peak concurrent count below 10% of in-person attendance may indicate discoverability, scheduling, or promotional deficiencies. A count above 30% indicates strong adoption and potentially an audience segment that exclusively engages online.
Average Watch Time
Average watch time measures the mean duration each viewer spends watching the stream. For a standard 60-75 minute church service broadcast, average watch times fall into three tiers: below 20 minutes (low engagement), 20-40 minutes (moderate engagement), and above 40 minutes (high engagement) (Resi Media, “State of Church Streaming Report,” 2024).
Declining average watch time across consecutive weeks signals a problem. Common causes include recurring technical issues, inconsistent broadcast schedules, low visual variety from single static camera angles, and audio quality degradation. Multi-camera production setups using two or three camera angles reduce visual monotony. A 2-camera live streaming kit provides the minimum hardware configuration for dynamic shot variety, enabling alternation between wide and close-up framing.
Viewer Retention Curve
The retention curve is a graph showing the percentage of initial viewers who remain at each point in the broadcast. YouTube Studio and Facebook Creator Studio generate retention curves automatically for each livestream.
A steep drop in the first five minutes followed by stabilization is a normal pattern. Viewers who remain past the five-minute mark demonstrate a higher probability of watching through the majority of the service. Retention above 50% at the midpoint of a service stream indicates effective content delivery and acceptable technical quality (Dacast, “Live Streaming Statistics and Benchmarks,” 2024). Sharp drops at specific timestamps often correlate with identifiable technical failures: buffering events, audio dropouts, or visual quality degradation.
Chat and Comment Engagement
Platforms supporting live chat (YouTube Live, Facebook Live) enable real-time text interaction during the broadcast. Chat engagement rate is calculated as: (number of unique chatters / total concurrent viewers) x 100. A rate of 5-15% is typical for church livestreams (StreamYard community benchmarks, 2023).
Chat engagement serves as both a metric and a retention mechanism. Viewers who participate in chat demonstrate active attention and are statistically less likely to leave the stream early. Monitoring chat also provides real-time feedback on technical issues, as viewers frequently report audio problems, buffering, or visual quality concerns before the production team detects them through internal monitoring.
Replay Views
Replay views (also called video-on-demand views or VOD views) count individuals who watch the recorded stream after the live broadcast ends. For many churches, replay views equal or exceed live concurrent viewer counts. A common ratio is 1:1 to 3:1 replay-to-live viewership (BoxCast, “Church Streaming Statistics and Trends,” 2023).
Replay views accumulate most rapidly within 48-72 hours of the original broadcast. A high replay-to-live ratio may indicate scheduling issues (viewers prefer to watch at a different time) or strong content that generates sharing. Replay views also extend the content lifecycle of each broadcast, increasing total viewer minutes per production effort.
Behavioral Metrics
Online Giving Correlation
Online giving during or immediately following a livestream serves as a behavioral depth indicator. Giving platforms such as Tithe.ly, Pushpay, and Planning Center Giving log timestamps for each transaction, enabling correlation analysis between giving activity and livestream broadcast windows.
Churches with integrated giving links in stream descriptions or video overlays report that 15-25% of total weekly online giving occurs during livestream broadcast windows (Tithe.ly, “Digital Giving Trends in Churches,” 2023). Consistent week-over-week giving during stream windows is a more reliable effectiveness indicator than absolute giving amounts, as individual gift sizes fluctuate based on factors unrelated to stream quality.
Follow-Up Action Completion
Follow-up actions include prayer request submissions, connection card completions, event registrations, volunteer signups, and small group inquiries initiated through links provided during or after the livestream. Tracking these actions requires integration between the streaming platform and a church management system (ChMS) such as Planning Center, Breeze, or Church Community Builder.
A follow-up action rate of 2-5% of total viewers (live plus replay combined) indicates active engagement beyond passive viewing. Rates below 1% suggest either insufficient calls to action within the broadcast or a disconnect between the stream content and the available response mechanisms.
Social Media Shares
Share count measures how many times the livestream link is redistributed on social platforms by viewers. Facebook reports share counts directly for live videos. YouTube tracks external traffic sources that indicate sharing behavior.
A share rate of 1-3% of total viewers is typical for church and nonprofit content (Hootsuite, “Social Media Benchmarks for Nonprofits,” 2024). Shares represent organic audience growth, as each share exposes the stream to the sharer’s network. Monitoring which stream segments generate the most shares (identifiable through traffic spikes at specific times after the broadcast) provides data on which content types resonate most effectively.
New Versus Returning Viewer Analysis
Tracking new versus returning viewers identifies whether a livestream attracts new audiences or primarily serves existing congregation members. YouTube Analytics provides new versus returning viewer segmentation under the Audience tab. Facebook Insights reports similar data through reach and frequency metrics.
A ratio of 15-25% new viewers per stream indicates healthy audience growth and discoverability (Carey Nieuwhof / The Art of Leadership Academy, “Online Church Metrics That Matter,” 2023). Consistently low new viewer percentages (below 10%) may indicate limited search engine visibility, insufficient social media promotion, or metadata optimization issues (titles, descriptions, tags). Consistently high new viewer percentages (above 40%) with low retention may indicate that the content does not match viewer expectations set by titles and thumbnails.
Device and Geographic Analytics
Platform analytics report viewer device type (mobile, desktop, smart TV, tablet) and geographic location. These data points inform technical and content optimization decisions.
If mobile viewers constitute 60% or more of total viewership, stream encoding settings, lower-third graphic sizing, and text overlay legibility must account for small screen dimensions. Geographic data identifies whether the stream primarily serves the local congregation area or reaches a broader regional or national audience. Shifts in geographic distribution over time indicate changes in discoverability and promotional effectiveness.
Technical Infrastructure and Video Quality Impact
Camera Configuration
The number of cameras and the variety of available angles directly affect viewer retention. Single static camera setups produce a visually monotonous output that correlates with shorter average watch times. Multi-camera configurations enable shot variety: wide establishing shots, medium shots of the stage, and close-ups of speakers.
A 3-camera live streaming kit provides wide, medium, and close-up angles simultaneously, enabling the production operator to switch between shots in real time. PTZ (pan-tilt-zoom) cameras such as the PTZOptics Move 4K add remote-controlled movement and zoom capability, further increasing visual variety without requiring additional camera operators.
Encoding and Switching Hardware
The video switcher or encoder determines the maximum output quality of the stream. Hardware-based switchers such as the Blackmagic ATEM Mini series process video signals with dedicated chips, producing consistent output without the frame drops and latency spikes common in software-only workflows.
All-in-one streaming solutions such as the YoloBox Pro combine switching, encoding, monitoring, and streaming into a single portable device. These devices reduce the number of potential failure points in the signal chain by eliminating cable runs and adapter connections between separate components.
Internet Connection
A stable, dedicated internet connection is a prerequisite for consistent stream quality. The minimum recommended upload bandwidth is 2x the target encoding bitrate. For a stream encoded at 6,000 kbps (6 Mbps), the connection must sustain at least 12 Mbps of upload throughput consistently throughout the broadcast.
Wired Ethernet connections are preferred over Wi-Fi. A dedicated internet circuit, separate from the congregation’s guest Wi-Fi network, prevents bandwidth competition during services. Cellular bonding devices serve as backup connections but introduce variable latency.
Measurement Frequency and Benchmarking
Effective livestream evaluation requires consistent, recurring measurement rather than one-time assessment. The recommended measurement cadence:
- Weekly: Concurrent viewers, average watch time, chat engagement rate, stream health metrics (bitrate, dropped frames), online giving during stream window.
- Monthly: Retention curve trends, replay-to-live ratio, new vs. returning viewer ratio, follow-up action completion rate, social media share rate.
- Quarterly: Device and geographic distribution shifts, year-over-year comparisons, correlation analysis between technical upgrades and engagement changes.
Benchmarking against internal historical data is more informative than benchmarking against external averages. Church size, denomination, geographic location, streaming platform, and broadcast schedule all create variables that make direct inter-church comparisons unreliable. A church’s own quarter-over-quarter trend lines provide the most actionable performance data.
Summary of Key Performance Indicators
| Metric | Below Average | Average | Above Average |
|---|---|---|---|
| Peak concurrent viewers (% of in-person attendance) | Below 10% | 10-20% | Above 20% |
| Average watch time (60-minute service) | Below 20 minutes | 20-40 minutes | Above 40 minutes |
| Midpoint retention | Below 30% | 30-50% | Above 50% |
| Chat engagement rate | Below 3% | 3-10% | Above 10% |
| Replay-to-live viewer ratio | Below 0.5:1 | 0.5-2:1 | Above 2:1 |
| Follow-up action rate | Below 1% | 1-3% | Above 3% |
| New viewer percentage per stream | Below 10% | 10-20% | Above 20% |
| Dropped frame rate | Above 1% | 0.1-1% | Below 0.1% |
(Compiled from Resi Media, BoxCast, Dacast, Church Answers, and Hootsuite data, 2023-2024)